A crypto watchlist is most useful when it helps you pay attention selectively. A long list of symbols without a reason to follow them can become another stream of noise. A better list records what caught your attention, what question you want to answer and what would make you review the asset again. It is a research aid, not a shortlist of trades.
The CryptoWave dashboard brings together a private watchlist, favorite coins, a simple portfolio estimate, price alerts, market context and research notes. These tools have different jobs. Learning the difference makes your workspace easier to scan and helps prevent a saved symbol or alert from being mistaken for a recommendation.
Separate things you follow from things you own
Start by deciding what belongs in each list. Use the dashboard watchlist for assets you are currently researching or want to monitor. Use Favorite coins to bookmark assets you want to reach quickly from CryptoWave. Use the Portfolio widget only for positions whose quantity and average buy price you want to enter for an estimated value and unrealized performance. The same asset can appear in more than one place, but each entry should serve a clear purpose.
This separation keeps an idea from being confused with a holding. A token you are investigating does not belong in your personal portfolio estimate until you enter an actual position. A favorite is a shortcut, not a statement that you own the asset. Give a watchlist item a short reason such as “review network activity” or “compare liquidity,” so you remember why it is there when you return.
Build a short list around research questions
There is no ideal number of assets for everyone. Begin with a manageable group and add an item only when you can say what you want to learn. You might be comparing projects in one sector, tracking a token you already hold, or following a market event. Keep these reasons in a private note or a separate research log instead of relying on memory.
Use CryptoWave’s market screener to explore assets by rank, market capitalization, reported volume and recent price changes. Search by name or symbol, then look at the asset page for more context. A screen can reduce a large market list to candidates worth investigating, but the displayed fields do not explain the project’s full fundamentals, token distribution, contract behavior or risks.
When a candidate interests you, write down the observation and the next question. For example: “Volume increased while the daily price was lower—check whether the move appears across more than one venue.” That statement is testable. “This will go up” is a prediction and does not explain what evidence would change your view.
Use price alerts as reminders to review
A price alert is a threshold that asks you to look again when an observed price is above or below a level you selected. It does not explain why a market moved, tell you whether to buy or sell, or protect you from rapid price gaps. Select levels that relate to a specific review question, and remove alerts that no longer have a purpose.
In the CryptoWave dashboard, choose an asset, select whether its price should move above or below a target, and enter the target in USD. The dashboard checks the current market snapshot when it opens and while it refreshes. Alert status is evaluated in the page; the feature does not send email or background push notifications while the dashboard is closed. If you rely on an alert, return to the dashboard and confirm the latest displayed price and time context before drawing a conclusion.
A single threshold can be crossed briefly and then reversed. Consider what you will check if it triggers: volume, broader market movement, project announcements, venue liquidity or another source. Do not set a large number of arbitrary levels. Too many alerts can make it harder to notice the one that still matters.
Read portfolio figures as estimates
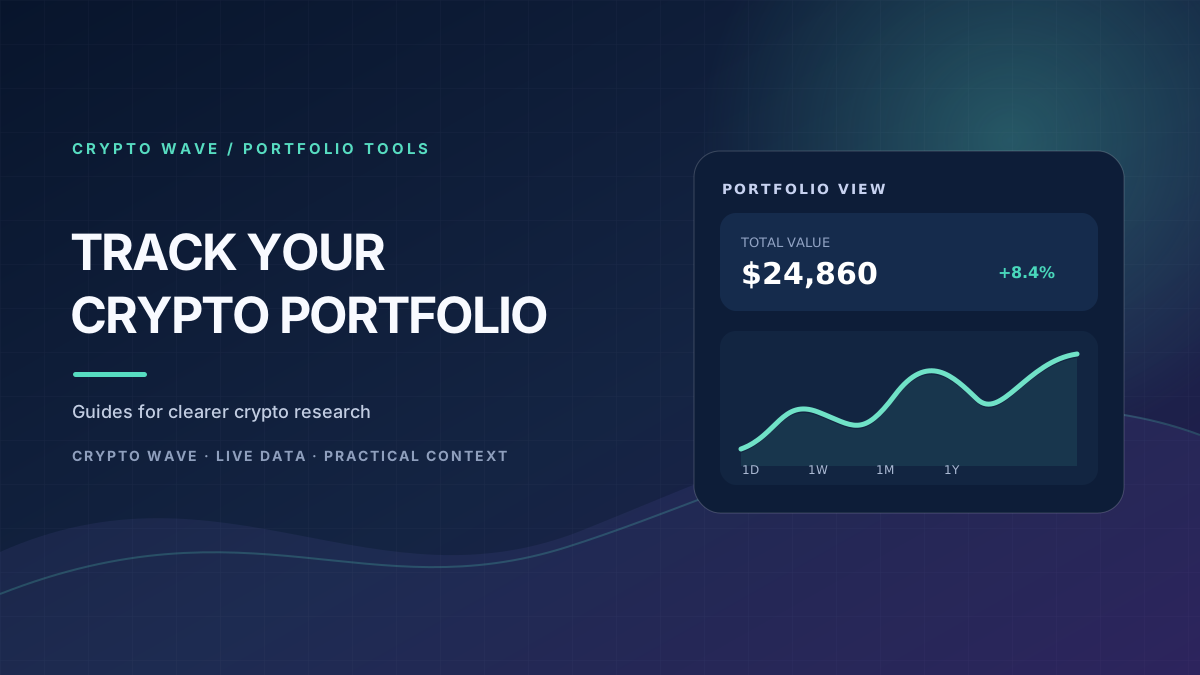
The Portfolio widget asks for an asset, quantity and average buy price in USD. It multiplies the quantity by CryptoWave’s current price snapshot to show an estimated value, then compares that estimate with the entered cost basis. The result is a simple, unrealized estimate. It is not an exchange statement, tax report, complete transaction ledger or guarantee that a position can be sold at the displayed price.
Fees, deposits, withdrawals, staking rewards, transfers between wallets, partial sales and multiple purchase prices can make a basic average-price entry differ from your records. Use the portfolio widget for a quick overview, and reconcile your full activity with your exchange or wallet records. CryptoWave’s existing transaction-history page remains separate from the dashboard estimate.
Prices on an asset page or portfolio widget can update on a schedule and may come from a provider snapshot. Markets can change between updates, and quoted prices may differ across venues. If a number matters for an actual transaction or accounting task, verify it with the relevant platform and your own records.
Connect market context to your list
Check a watchlist alongside the broader market. The market heatmap gives a quick view of relative market size and recent movement for its mapped assets. The comparison tool can put up to three assets side by side across price, market capitalization, volume, recent change and selected supply fields. These views make comparisons easier; they do not make the underlying provider data complete or directly comparable in every case.
For example, a token’s percentage move may look dramatic while its reported volume is small. Another asset may have a large market capitalization but limited liquidity on the venue you use. Treat each field as a clue to investigate, and open the asset page or primary project documentation when you need more detail. A market-cap figure is not the amount of money available to sell at the displayed price.
Keep notes that can be reviewed
Use a note to record the date, observation, source and next check. Separate what you observed from what you infer. “Provider snapshot showed a 24-hour move of X at 10:00 UTC” is an observation. “The project is gaining adoption” is a conclusion that needs evidence beyond the price field.
CryptoWave’s private research area lets you save market observations and arrange dashboard widgets. Put the information you check often near the top, and hide widgets that distract you. A useful weekly review can remove stale symbols, close alerts that no longer matter and revisit whether each note has been answered. The purpose is to make your process clearer, not to make more market activity.
A simple setup routine
- Add only assets tied to a current research question.
- Use Favorites for shortcuts, a Watchlist for monitoring and Portfolio for entered positions.
- Set a small number of review thresholds and understand when the dashboard checks them.
- Compare price, volume, market size and broader market movement together.
- Record the date and source for important observations.
- Review the list periodically and remove items that no longer help.
Open your private CryptoWave dashboard to organize a watchlist, portfolio estimate, alerts and notes. Market information can be incomplete, delayed or different across providers. These tools are for research and organization; they are not investment, tax or trading advice.